Understand your scan analytics
Aggiornato il 19 settembre 20265 min di lettura
Articolo in inglese
Questa guida non è ancora tradotta nella tua lingua: stai leggendo la versione inglese.
Every scan of a dynamic code passes through Qreator before the visitor reaches your page, which is what makes measurement possible. Static codes cannot be measured at all: they contain your destination directly and nothing sits in between.
What each metric tells you
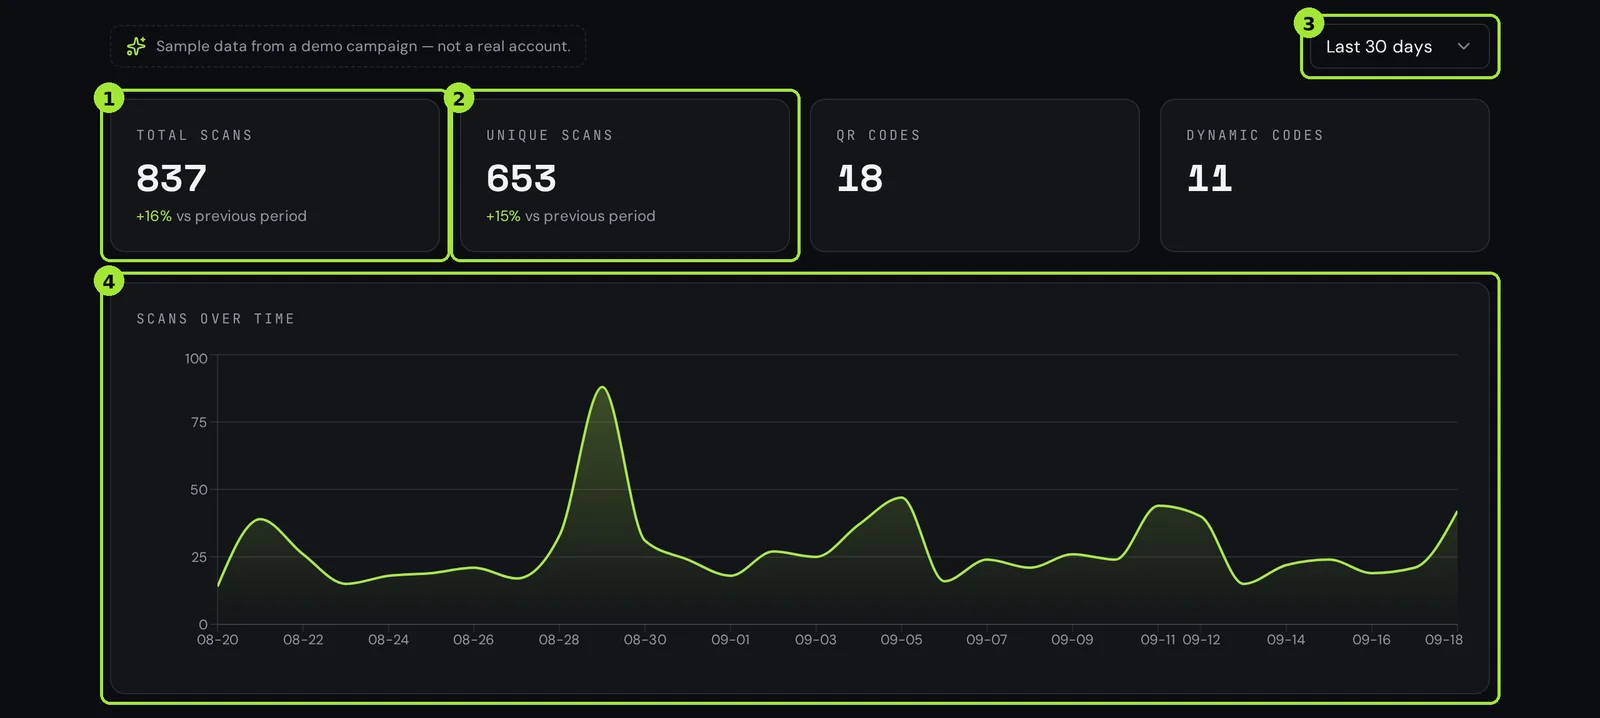
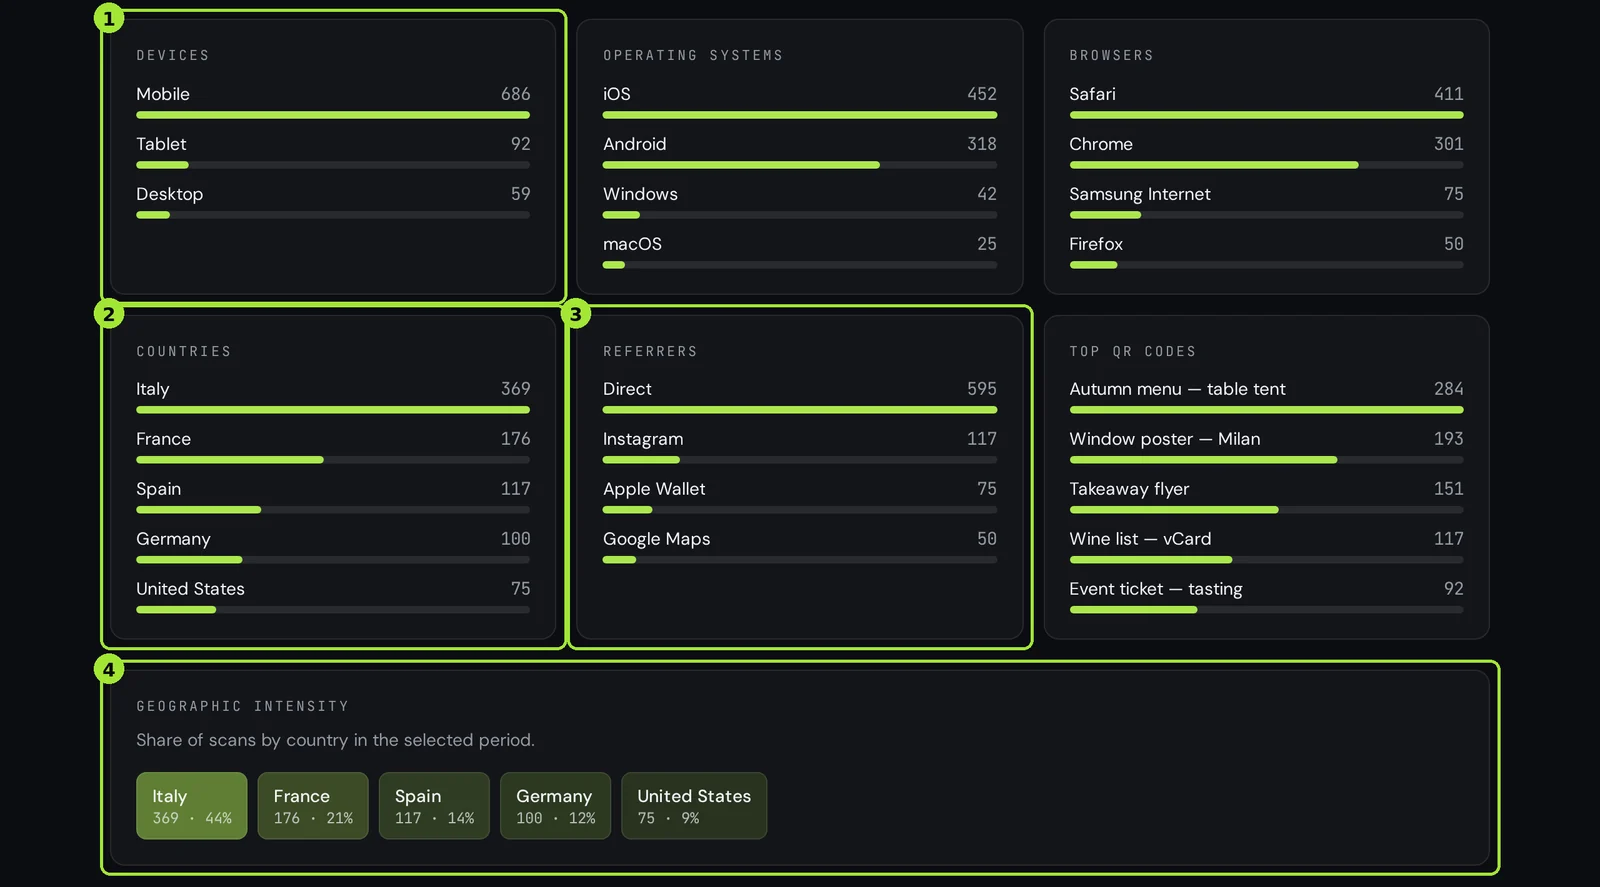
| Metric | What it answers | Act on it when |
|---|---|---|
| Scans over time | Is the campaign alive, and when do people scan? | A peak tells you when to post; a flat line means the placement is wrong. |
| Countries | Where is the printed material actually working? | One country outperforms the rest — print more there, or add a local destination. |
| Devices | iPhone or Android, mobile or tablet? | Split traffic to the right app store, or fix a page that only breaks on one platform. |
| Referrers | Did the scan come from a wallet app, a browser, a re-share? | Unexpected referrers usually mean your link is being copied and shared — worth encouraging. |
| Last scan | Is this code still in use? | Nothing for months: retire the code or reuse it for the next campaign. |
Compare two periods, not one
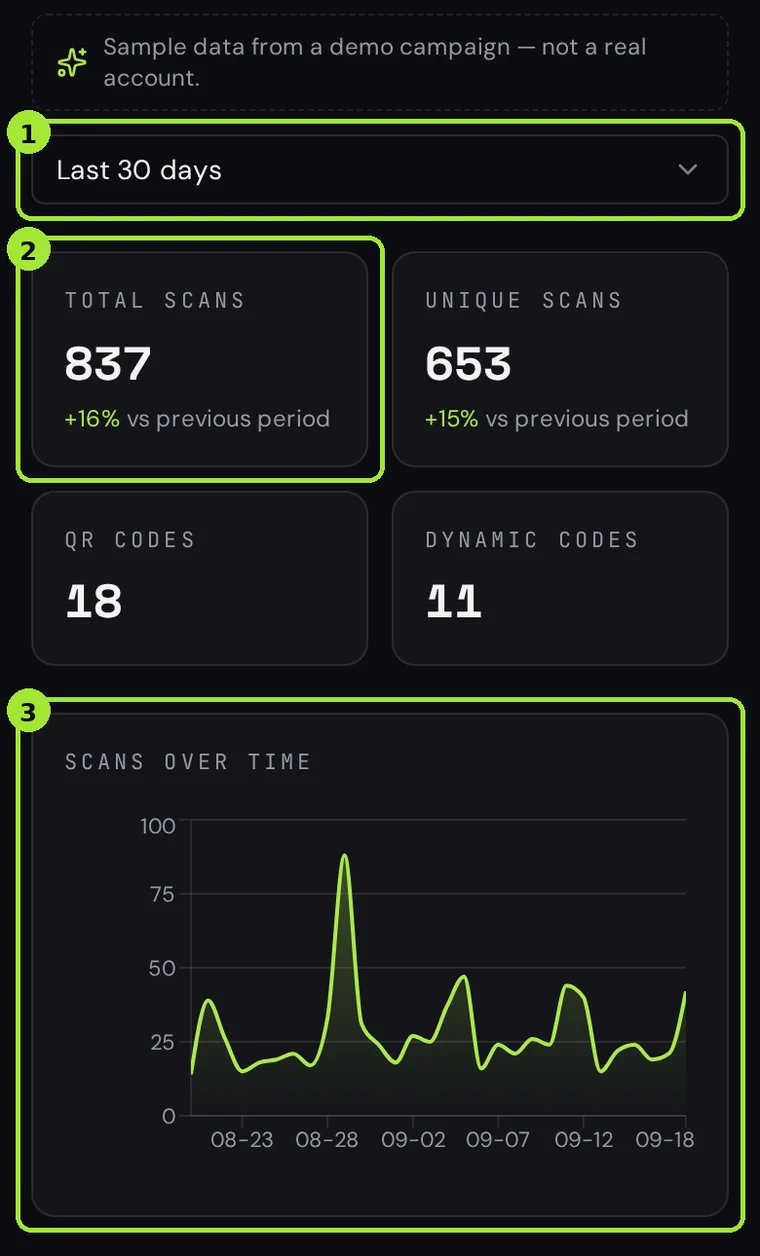
A single total means very little. The dashboard can compare the selected range with the equivalent range before it, so you see whether last week beat the week before rather than just how many scans happened.
How this stays privacy-friendly
- No cookie is written on the visitor's device to count a scan.
- IP addresses are hashed, never stored in readable form, and used only to derive an approximate country.
- We record device type, not a device identifier, so returning individuals cannot be re-identified.
Get the data out
Any range can be exported as CSV for your own analysis, or as a PDF for a client report. Scheduled reports can send a summary to any address weekly or monthly, so nobody has to remember to log in. Both are paid features: CSV and PDF export and scheduled reports come with Pro and Business.
Send scans to Google Analytics
If your reporting lives in GA4, a code can forward each scan server-side, so scans appear alongside the rest of your traffic even when the visitor blocks browser tracking.
Domande frequenti
- Can I track scans of a static QR code?
- No. A static code contains your destination directly, so no system sees the scan. Use a dynamic code, or add UTM parameters and read them in your own analytics.
- Do you count the same person twice?
- Every resolution is recorded, so a visitor who scans twice counts twice. We deliberately do not fingerprint devices to deduplicate.
- Is scan tracking GDPR-friendly?
- It is designed to be: no tracking cookie, hashed IPs, coarse location and no device identifier. Keep your own privacy notice up to date for the destination page.
Prossimi passi
- Track QR code scans in Google Analytics 4Tag the destination with UTMs, then forward every scan to GA4 server-side so offline traffic sits next to your web channels.
- Change where a printed QR code pointsThe single feature people buy dynamic codes for: update the link, keep the print.
- Plans, upgrades and invoicesHow billing works, and the one rule that matters: your dynamic codes keep resolving.
Guide approfondite
- How to track QR scans without breaking the GDPRA practical walkthrough of what a QR scan request exposes and how to measure it without becoming a data protection problem.
- QR code or short link? When to use whichA QR code is a transport for a string and a short link is a redirect service — knowing the difference tells you which one belongs on which channel.